
Case study · Aesthetic clinic · Montreal, Quebec
From $2,600/month at a low point to a record $7,502: The impact of a business strategy and an optimized digital ecosystem
When a talented beautician lacks the structure to turn her expertise into steady income, that's exactly where a strategic diagnosis comes in. Here’s how a Montreal aesthetic clinic increased its revenue by 59% in 12 months, thanks to a complete restructuring of its business model and solid digital foundations.
The Starting Point: Growth Barrier Analysis
She had the expertise. What she lacked was the digital roadmap to turn it into a profitable, predictable business.
Brand image deficit: Inconsistent logo and visual direction. In an industry built on experience and premium positioning, the absence of a strong identity undermined perceived value and trust before the first appointment.
Web conversion leak: The existing platform wasn't built for action. Traffic came in and left without booking, making every visibility effort pointless.
Undervalued offer and profitability loss: She was travelling to her clinic for free consultations and failing to highlight her highest-value treatments. She was trading her time for insufficient revenue.
Flying blind: No clear financial targets, no visibility into the real profitability of each service relative to the time invested.
AIMOPS' Mandate as Digital Strategist: Act as a strategic partner: structure, guide, and build alongside the client a realistic action plan aligned with her business goals, one she could fully own and execute independently.
The Strategic Approach: 4 Steps Toward Profitability
Step 1: Business Diagnostic & Clarity
Before deploying any tools, we solidified the foundations: aligning the vision at 1, 3, and 5 years, establishing clear revenue targets, and conducting a full social media audit (Instagram, Facebook, TikTok) to identify where her ideal clients actually were.
Step 2: Brand Foundations & Credibility
Creation of a logo and cohesive visual direction. The critical objective: instantly projecting a professional, trustworthy image that reflects the quality of her treatments, acting as a first conversion filter online.
Step 3: Offer Restructuring & Revenue Engineering
End of free home visits and introduction of properly valued consultations. Strategic price increases and reprioritization to push the highest-margin services forward. Every hour worked became immediately more profitable.
Step 4: Autonomous Content System & Advisory Support
Creation of a simplified monthly editorial calendar adapted to her busy schedule, allowing her to publish independently and without pressure to consistently nurture her community.
Note: The client expressed interest in running targeted campaigns at key moments (August and March). I supported and guided her thinking with the help of a monthly editorial calendar to ensure her advertising initiatives aligned seamlessly with our content and brand strategy, maximizing her investment.
Key Deliverables
Complete business diagnostic - Brand identity & visual direction - Pricing strategy & revenue model - Autonomous content calendar - Website audit & full rebuild
Critical Analysis of Results After 12 Months
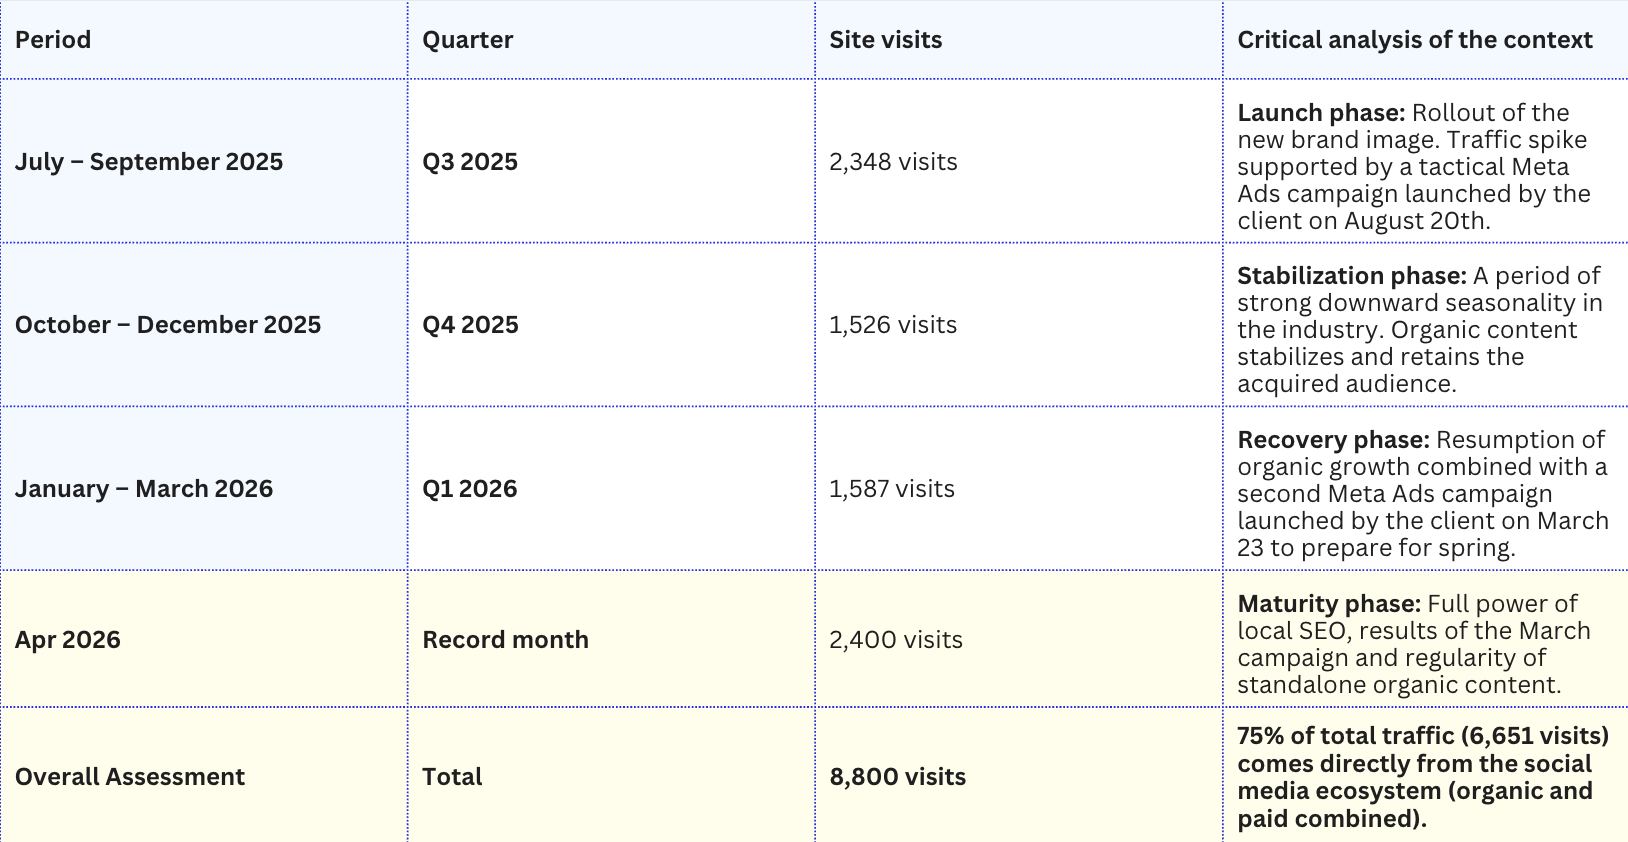
Grouping by quarter smooths out the industry's natural seasonality and allows us to measure the real impact of the content strategy.
Q3 2025 (Jul.–Sep.): 2,348 visits → Launch of the new brand identity and deployment of the content strategy.
Q4 2025 (Oct.–Dec.): 1,526 visits → Peak seasonality period in the industry; audience stabilization.
Q1 2026 (Jan.–Mar.): 1,587 visits → Growth resumption and optimization of organic conversion funnels.
April 2026 (record month): 2,400 visits → Organic content maturity and surge in local search queries.
8,800 visits over 12 months: 75% of total traffic (6,651 visits) driven directly by social media.
Direct and Measurable Revenue Impact
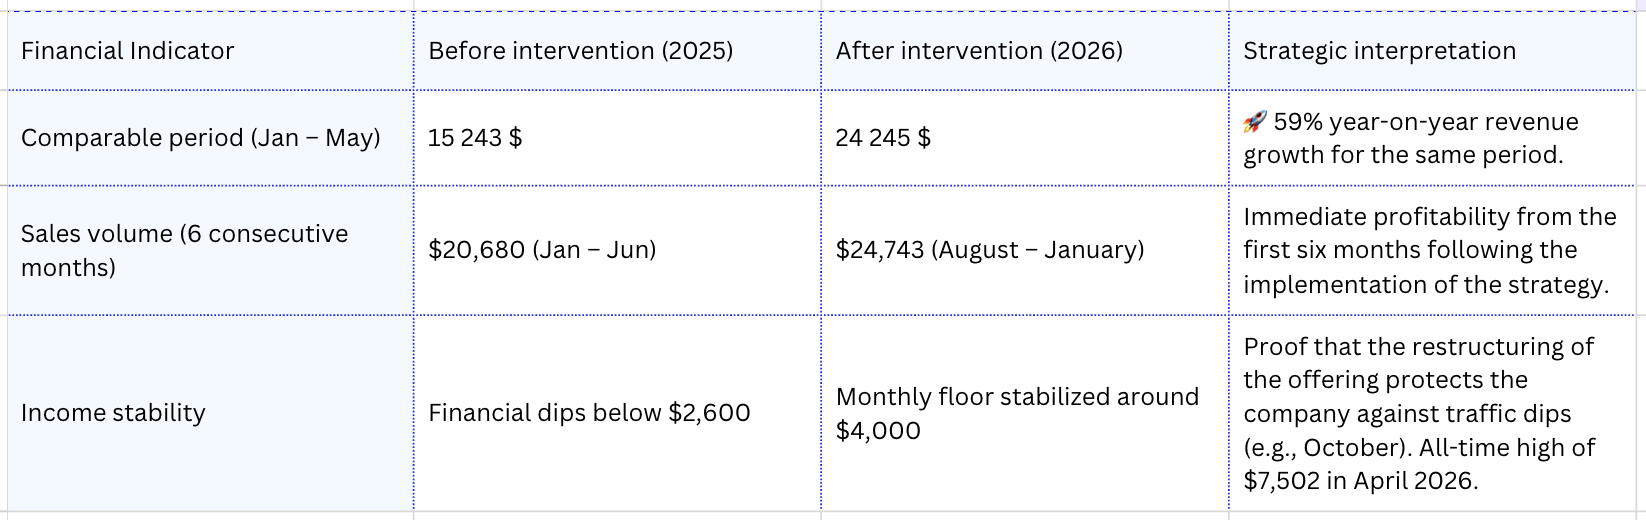
+59% in revenue: For the comparable period of January through May, revenue grew from $15,243 (2025, pre-intervention) to $24,245 (2026, post-intervention).
Stabilized financial floor: While the clinic previously experienced slow months below $2,600, it now maintains a stable monthly baseline, with an all-time high of $7,502 reached in April 2026.
Immediate profitability: Within the first 6 months following strategy implementation (August 2025 to January 2026), revenue reached $24,743, compared to $20,680 for the 6 months preceding the mandate.
Conclusion: This Digital Shift Is Just the Beginning
The results of this case study demonstrate that healthy growth doesn't depend on an endless advertising budget being continuously pumped in, but rather on an optimized business structure in which the client's advertising initiatives amplify already solid foundations.
We continue to collaborate today because a well-implemented strategy doesn't stop: it gets analyzed, adapted, optimized, and keeps generating growth.
Performance data is shared with the client's authorization. Results reflect the reality of a self-employed entrepreneur in the medical aesthetics industry and vary depending on each business's context.